 Nick Holman

17
BYE
NA

Ads provide web developers the support to continue providing their services. If our ads are of annoyance, please provide recommendations to help us improve.
Nick Holman
DT Average Against the Opposition
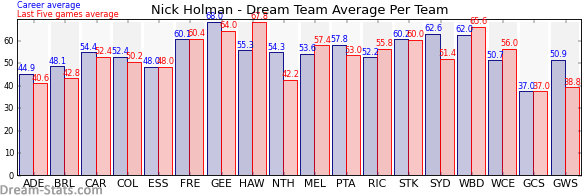
| Team | Games | Last 5 Avg. | Overall Avg. | Difference |
|---|---|---|---|---|
| Western Bulldogs | 10 | 65.6 | 62.0 | 3.6 |
| Geelong | 6 | 64.0 | 68.0 | -4.0 |
| Fremantle | 9 | 61.8 | 59.3 | 2.5 |
| St. Kilda | 9 | 60.0 | 60.2 | -0.2 |
| Hawthorn | 10 | 58.8 | 54.9 | 3.9 |
| Port Adelaide | 9 | 58.8 | 57.1 | 1.7 |
| Melbourne | 7 | 57.4 | 53.6 | 3.8 |
| West Coast | 9 | 56.0 | 50.7 | 5.3 |
| Sydney | 8 | 51.4 | 62.6 | -11.2 |
| Collingwood | 8 | 50.2 | 52.4 | -2.2 |
| Essendon | 5 | 48.0 | 48.0 | 0.0 |
| Richmond | 10 | 46.0 | 47.4 | -1.4 |
| Brisbane | 12 | 42.8 | 48.1 | -5.3 |
| Carlton | 8 | 41.0 | 50.6 | -9.6 |
| Adelaide | 7 | 40.6 | 44.9 | -4.3 |
| Gold Coast | 1 | 37.0 | 37.0 | 0.0 |
| Western Sydney | 10 | 34.4 | 49.3 | -14.9 |
| North Melbourne | 11 | 32.4 | 51.2 | -18.8 |
Ads provide web developers the support to continue providing their services. If our ads are of annoyance, please provide recommendations to help us improve.