 Tom Papley

17
BYE
NA
PTA
NTH
4:40PMSUN
July 05
Adelaide Oval

Ads provide web developers the support to continue providing their services. If our ads are of annoyance, please provide recommendations to help us improve.
Tom Papley
2017 Yearly Statistics
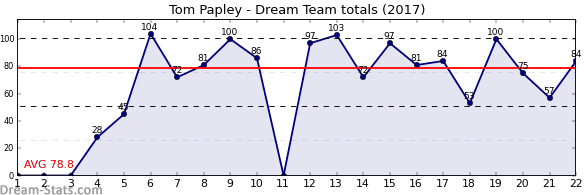
| OPP | RND | DT | D | K | H | M | T | HO | FF | FA | G | B |
|---|---|---|---|---|---|---|---|---|---|---|---|---|
| WCE | 4 | 28 | 6 | 4 | 2 | 2 | 1 | 0 | 1 | 2 | 1 | 1 |
| GWS | 5 | 45 | 9 | 6 | 3 | 4 | 2 | 0 | 0 | 2 | 1 | 1 |
| CAR | 6 | 104 | 16 | 15 | 1 | 8 | 5 | 0 | 2 | 1 | 2 | 2 |
| BRL | 7 | 72 | 19 | 10 | 9 | 6 | 1 | 0 | 1 | 0 | 0 | 1 |
| NTH | 8 | 81 | 15 | 10 | 5 | 5 | 3 | 0 | 1 | 0 | 2 | 1 |
| STK | 9 | 100 | 20 | 11 | 9 | 6 | 4 | 0 | 1 | 0 | 2 | 2 |
| HAW | 10 | 86 | 18 | 10 | 8 | 6 | 3 | 0 | 2 | 0 | 1 | 2 |
| WBD | 12 | 97 | 21 | 9 | 12 | 0 | 8 | 0 | 1 | 0 | 2 | 1 |
| RIC | 13 | 103 | 19 | 13 | 6 | 6 | 7 | 0 | 1 | 1 | 1 | 2 |
| ESS | 14 | 72 | 12 | 5 | 7 | 4 | 6 | 0 | 1 | 0 | 1 | 0 |
| MEL | 15 | 97 | 25 | 12 | 13 | 5 | 4 | 0 | 0 | 3 | 2 | 1 |
| GCS | 16 | 81 | 20 | 11 | 9 | 1 | 6 | 0 | 0 | 1 | 1 | 0 |
| GWS | 17 | 84 | 10 | 9 | 1 | 1 | 8 | 0 | 2 | 0 | 3 | 0 |
| STK | 18 | 53 | 15 | 10 | 5 | 3 | 3 | 0 | 1 | 3 | 0 | 0 |
| HAW | 19 | 100 | 17 | 15 | 2 | 4 | 4 | 0 | 2 | 0 | 3 | 3 |
| GEE | 20 | 75 | 12 | 8 | 4 | 2 | 4 | 0 | 1 | 0 | 3 | 2 |
| FRE | 21 | 57 | 16 | 7 | 9 | 0 | 3 | 0 | 0 | 2 | 2 | 0 |
| ADE | 22 | 84 | 16 | 12 | 4 | 0 | 9 | 0 | 1 | 1 | 1 | 0 |
| ESS | 24 | 58 | 16 | 8 | 8 | 2 | 3 | 0 | 0 | 2 | 1 | 0 |
| GEE | 25 | 43 | 10 | 8 | 2 | 2 | 2 | 0 | 1 | 2 | 1 | 0 |
| GEE | 25 | 43 | 10 | 8 | 2 | 2 | 2 | 0 | 1 | 2 | 1 | 0 |
| GEE | 25 | 43 | 10 | 8 | 2 | 2 | 2 | 0 | 1 | 2 | 1 | 0 |
| SUM | 1606 | 332 | 209 | 123 | 71 | 90 | 0 | 21 | 24 | 32 | 19 | |
| AVG | 73.0 | 15.1 | 9.5 | 5.6 | 3.2 | 4.1 | 0.0 | 1.0 | 1.1 | 1.5 | 0.9 |
Ads provide web developers the support to continue providing their services. If our ads are of annoyance, please provide recommendations to help us improve.