
BYE
CAR COL FRE HAW

Diamonds in the Rough - The Most Overlooked
19 / 03 / 2012
This article takes a look at players who have gone under the radar so far in 2012. It features players who may not have had the best start to 2011, but finished strongly by averaging significantly more in the second half of the season. For players to be featured in the article, they have to meet the following criteria:
- Chosen by less than 10% of AFL Dream Team coaches so far
- See a 15% DT increase in the 2nd half of 2011
- Averaged over 85 in the 2nd half of 2011
- Priced above $375,000 in 2012
With the above criteria, there have been some surprising omitions from the majority of Dream Teams. Tom Rockliff was a popular pick last year yet not so many seem confident to jump on board in 2012, despite having the third best average in the competition between rounds 12 to 23. Nick Dal Santo had a better average than Ablett in the second half and had 10 consecutive 100+ matches, yet is only featured in 3% of teams so far. The most surprising statistic gathered is Brent Stanton's. How many would have known he average 118.1 in the second half of the year, moreso than Boyd, Ablett and Pendlebury? I certainly didn't and I'm guessing the majority of the Dream Team public hasn't too, considerin he's only been selected by one percent of Dream Team coaches so far!
What's interesting to note is the high amount of medium priced midfielders who are being overlooked. Callan Ward, Jack Ziebell, Bernie Vince and Tendai Mzungu all finished with respectable averages last year, yet make up less than 2% of Dream Teams. This may be due to the simple reason that there are other really popular picks which are similiarly priced such as Hayes, Barlow, Dangerfield, Burgoyne and Sidebottom. Would one really want to overlook Hayes, Barlow or Sidebottom for a similiarly priced Callan Ward or Jack Ziebell?
 Tom Rockliff($554,200) Tom Rockliff($554,200) | |
The only two players to average more than Tom Rockliff in the second half of last year were Sam Mitchell and Dane Swan. In the second half of the year, Rockliff scored 100+ Dream Team points in all the nine matches he played in. In fact, he didn't score below 110 from round 14 onwards. Not many people seem keen to carry on with Rockliff for 2012, despite his dominant finish to 2012. Part of it may be due to the similiarly priced premium players who are guaranteed to perform, which makes a lot of sense. Though if everyone picks the same players and avoid taking risks, where's the fun in that?! The winners will be the ones who choose right during the pre season and don't jump on the bandwagon of all the popular picks. | |
| Owned By | 4.1% |
| Position | MID |
| First Half Average | 102.4 |
| Games Played | 8 |
| Second Half Average | 118.5 |
| Games Played | 11 |
| Second Half Increase | 16.1 (15.7%) |
 Brent Stanton($528,300) Brent Stanton($528,300) | |
Brent Stanton's second half of 2011 was the fourth best of any player in the competition. No, that was not a typo. Stanton had a better second half then Pendlebury, Boyd, Murphy, Selwood and Ablett and he's currently priced lower than all five of them. The biggest surprise is that Stanton is only selected by 1% of Dream Team coaches. The fact that Stanton finished off last year with all guns firing yet has been completely ignored by coaches makes him a very unique pick that is bound to pay off. Between rounds 13 to 23, Stanton scored below 100 DT points only twice with scores of 93 and 98. Looking at his Dream Team Spread chart, most of his points last year came from both tackling and kicking.
In round 19, he scored 155 DT points against Collingwood and managed to rack up 14 tackles, the third highest tackle count all year. His kick to handball ratio is almost 2:1, higher than many other midfieldersin his price range. If you're still unsure on who to put into your midfield or just want to go against the trend, Stanton may be one of your better choices. | |
| Owned By | 1.1% |
| Position | MID |
| First Half Average | 93.0 |
| Games Played | 9 |
| Second Half Average | 118.1 |
| Games Played | 11 |
| Second Half Increase | 25.1 (27.0%) |
 Dayne Beams($502,800) Dayne Beams($502,800) | |
Like Stanton, Dayne Beams had a better second half to the year than many of the elite Dream Team midfielders, including fellow teammate Scott Pendlebury. Even though it was only from five matches, that does not change the fact that he scored well in all five matches. The concern is that for all three years of Beams' career, he's had a significantly better second half to the year when compared with his first. In 2009 his second half output increased by 42% and in 2010 by 16%. What's there to suggest it won't be the same for 2012? | |
| Owned By | 4.6% |
| Position | FWD, MID |
| First Half Average | 88.3 |
| Games Played | 8 |
| Second Half Average | 117.6 |
| Games Played | 5 |
| Second Half Increase | 29.3 (33.2%) |
 Nick Dal Santo($512,400) Nick Dal Santo($512,400) | |
In 2011, Nick Dal Santo proved that he is one of the elite midfielders in the competition, polling 27 Brownlow votes. His Dream Team output reflects his year, averaging 104 points per game. The difference between Dal Santo's second half compared to his first is the consistency. He scored twice in the 60s and once in the 50s, which really tanked his first half average. Looking at his second half to the year, he string scores of over 100 nine times in a row. There are two key reasons why Dal Santo saw such improvement in the latter part of the year. The first being St. Kilda as a whole improved significantly as they actually began winning games and the second being that he finally managed to break the tag. He also spent a lot more time playing off the half back flank and pushing off the ground, which contributed to him overcoming tags. | |
| Owned By | 3.0% |
| Position | MID |
| First Half Average | 94.3 |
| Games Played | 10 |
| Second Half Average | 114.6 |
| Games Played | 11 |
| Second Half Increase | 20.3 (21.5%) |
 Jordan Lewis($441,800) Jordan Lewis($441,800) | |
| Owned By | 3.2% |
| Position | FWD, MID |
| First Half Average | 75.8 |
| Games Played | 10 |
| Second Half Average | 104.3 |
| Games Played | 9 |
| Second Half Increase | 28.5 (37.6%) |
 Shane Mumford($452,400) Shane Mumford($452,400) | |
| Owned By | 7.9% |
| Position | RUC |
| First Half Average | 83.9 |
| Games Played | 8 |
| Second Half Average | 103.8 |
| Games Played | 8 |
| Second Half Increase | 19.9 (23.7%) |
| Ben Johnson($401,400) | |
| Owned By | 0.3% |
| Position | MID |
| First Half Average | 66.0 |
| Games Played | 6 |
| Second Half Average | 97.7 |
| Games Played | 6 |
| Second Half Increase | 31.7 (48.0%) |
| David Zaharakis($443,200) | |
| Owned By | 8.2% |
| Position | FWD, MID |
| First Half Average | 80.3 |
| Games Played | 10 |
| Second Half Average | 97.3 |
| Games Played | 12 |
| Second Half Increase | 17.0 (21.2%) |
 Robbie Gray($402,000) Robbie Gray($402,000) | |
| Owned By | 4.2% |
| Position | FWD, MID |
| First Half Average | 65.7 |
| Games Played | 11 |
| Second Half Average | 96.3 |
| Games Played | 10 |
| Second Half Increase | 30.6 (46.6%) |
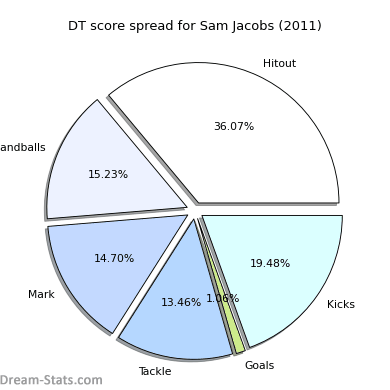
 Sam Jacobs($434,200) Sam Jacobs($434,200) | |
Being a key ruckmen for a team that is set to rise in 2012 is a very good sign for Dream Team coaches. Sam Jacobs finished off the year strongly, averaging 95 points from 11 games.
Over a third of his Dream Team points were from hitouts, which he averages 32 per game. As he enters the fourth year of his career, his bound to see continued improvement and hopefully begin averaging more disposals per game. The thing is, the ruckmen division has never better. There are so many options this year that people are no longer being predictable with their picks. It's no longer the Cox and Sandilands combination that we've been seeing for a few years now. Despite Jacobs' low adoption rate, there will be better options than Jacobs simply because a lot of the ruckmen being considered this year won't have a high selection rate to begin with. With that said, there is no doubt that Jacobs has gone under the radar, so if you're really considering a unique ruckman, Sam Jacobs is a worthy pick. | |
| Owned By | 3.9% |
| Position | RUC |
| First Half Average | 80.6 |
| Games Played | 7 |
| Second Half Average | 94.9 |
| Games Played | 11 |
| Second Half Increase | 14.3 (17.7%) |
| Domenic Cassisi($439,100) | |
| Owned By | 0.4% |
| Position | MID |
| First Half Average | 65.0 |
| Games Played | 2 |
| Second Half Average | 94.0 |
| Games Played | 10 |
| Second Half Increase | 29.0 (44.6%) |
 Ricky Petterd($390,400) Ricky Petterd($390,400) | |
| Owned By | 0.6% |
| Position | FWD |
| First Half Average | 62.2 |
| Games Played | 6 |
| Second Half Average | 89.9 |
| Games Played | 9 |
| Second Half Increase | 27.7 (44.5%) |
| Shane Savage($382,300) | |
| Owned By | 0.9% |
| Position | MID |
| First Half Average | 69.6 |
| Games Played | 9 |
| Second Half Average | 88.6 |
| Games Played | 7 |
| Second Half Increase | 19.0 (27.3%) |
| Clinton Jones($384,700) | |
| Owned By | 0.5% |
| Position | MID |
| First Half Average | 67.8 |
| Games Played | 10 |
| Second Half Average | 88.3 |
| Games Played | 11 |
| Second Half Increase | 20.5 (30.2%) |
 Callan Ward($404,300) Callan Ward($404,300) | |
Only 2% of all coaches have chosen Callan Ward, which is a surprise to say the least. Along with Scully, he'll be the key midfielder for the new GWS outfit, meaning good game time and a lot of his teammates looking for him. If Ward's preseason form is anything to go by, he is set up for big DT year. In the second round of the NAB Cup, Ward scored 101 points against Gold Coast. In the third round, Ward amassed 31 disposals and finished the day with 126 points. | |
| Owned By | 1.9% |
| Position | MID |
| First Half Average | 75.8 |
| Games Played | 10 |
| Second Half Average | 88.2 |
| Games Played | 11 |
| Second Half Increase | 12.4 (16.4%) |
 Danny Stanley($392,800) Danny Stanley($392,800) | |
| Owned By | 0.8% |
| Position | FWD |
| First Half Average | 70.4 |
| Games Played | 9 |
| Second Half Average | 88.0 |
| Games Played | 12 |
| Second Half Increase | 17.6 (25.0%) |
| Angus Monfries($393,800) | |
| Owned By | 2.5% |
| Position | FWD, MID |
| First Half Average | 68.6 |
| Games Played | 9 |
| Second Half Average | 87.9 |
| Games Played | 12 |
| Second Half Increase | 19.3 (28.1%) |
 Tendai Mzungu($400,000) Tendai Mzungu($400,000) | |
Fremantle have produced some great Dream Team rookies as of late. Palmer, Fyfe, Ballantyne, Hill, Barlow, Lower and Broughton all had relatively good debut seasons. Another to add to that list is Tendai Mzungu. There wouldn't have been many left begging for more with regard to Mzungu's output last year. He finished the year off with an average of 81 and scored over 80 in his last five games. Even so, many didn't feel he warranted another spot in their Dream Team this year. Tendai Mzungu has had a stellar preseason. He's the highest ranked midfielder who has played in three full games. It may just be the preseason, but it may also be indicative that Mzungu has adopted a new role under Ross Lyon, one that suits Mzungu's Dream Team prospects well. | |
| Owned By | 1.8% |
| Position | MID |
| First Half Average | 55.0 |
| Games Played | 3 |
| Second Half Average | 87.6 |
| Games Played | 10 |
| Second Half Increase | 32.6 (59.3%) |
 Jack Ziebell($384,900) Jack Ziebell($384,900) | |
| Owned By | 1.5% |
| Position | MID |
| First Half Average | 67.8 |
| Games Played | 10 |
| Second Half Average | 86.9 |
| Games Played | 11 |
| Second Half Increase | 19.1 (28.2%) |
| Nathan Bock($396,900) | |
| Owned By | 4.2% |
| Position | DEF |
| First Half Average | 71.3 |
| Games Played | 8 |
| Second Half Average | 86.3 |
| Games Played | 12 |
| Second Half Increase | 15.0 (21.0%) |
| Bernie Vince($400,100) | |
| Owned By | 1.7% |
| Position | MID |
| First Half Average | 74.2 |
| Games Played | 5 |
| Second Half Average | 85.4 |
| Games Played | 11 |
| Second Half Increase | 11.2 (15.1%) |
| Patrick Ryder($394,400) | |
| Owned By | 4.8% |
| Position | RUC |
| First Half Average | 72.9 |
| Games Played | 10 |
| Second Half Average | 85.4 |
| Games Played | 12 |
| Second Half Increase | 12.5 (17.1%) |

Thanks to rainman for the article suggestion!
Ads provide web developers the support to continue providing their services. If our ads are of annoyance, please provide recommendations to help us improve.